by Calculated Risk on 4/14/2025 11:16:00 AM
Today, in the Calculated Risk Real Estate Newsletter: Watch Inventory and Why Measures of Existing Home Inventory appear Different
A brief excerpt:
We are in a period of significant policy uncertainty and there isn’t a good historical analog for the current period. However, for housing, the key will be to watch inventory.
Existing home inventory will provide clues on house prices, and a combination of existing and new home inventory will indicate what will happen with housing starts.
Watch Inventory
Here are a few examples of when inventory helped me call some turning points for house prices (this section is an update to a previous article):
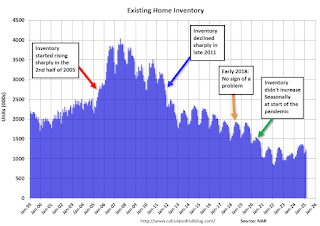
Starting in January 2005, I was very bearish on housing, but I wasn’t sure when the market would turn. Speculative bubbles can go on and on. However, the increase in inventory in late 2005 (see red arrow on graph below) helped me call the top for house prices in 2006.
Several years later, in early 2012, when many people were still bearish on housing, the plunge in inventory in 2011 (blue arrow on graph below) helped me call the bottom for house prices in early 2012 (see The Housing Bottom is Here).

There is much more in the article.


Leave a Reply