by Calculated Risk on 4/29/2025 03:32:00 PM
From the Las Vegas Visitor Authority: March 2025 Las Vegas Visitor Statistics
With a slightly less‐packed event calendar and as‐yet unclear impacts of evolving federal policies
rippling thru international and domestic markets, visitation saw a ‐7.8% YoY decline as the
destination hosted approximately 3.39 million visitors in March.Rotation cycles helped convention attendance in March as the destination hosted roughly 534k
attendees for the month, up 10.2% YoY, reflecting in part the calendar impact of the in‐rotation of
the Healthcare Information & Management Systems Society conference (48k attendees) which
was held elsewhere last year.Occupancy reached 82.9%, down ‐2.4 pts with Weekend occupancy of 90.8% (down ‐1.0 pts) and
Midweek occupancy of 79.7% (down ‐2.5 pts). ADR for the month reached $184 (+3.1% YoY) with
RevPAR of $152 (+0.2% YoY).
emphasis added
 Click on graph for larger image.
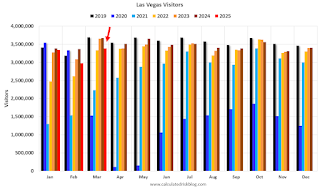
The first graph shows visitor traffic for 2019 (Black), 2020 (dark blue), 2021 (light blue), 2022 (light orange), 2023 (orange), 2024 (dark orange) and 2025 (red).
Visitor traffic was down 7.8% compared to last March. Visitor traffic was down 8.4% compared to March 2019.
The second graph shows convention traffic.

Convention traffic was up 10.2% compared to March 2024, and down 17.8% compared to March 2019.
YTD convention traffic is down 5.8% compared to 2019.


Leave a Reply