by Calculated Risk on 4/25/2025 03:53:00 PM
From the Philly Fed:
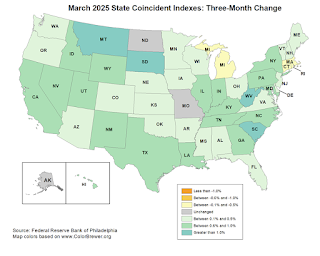
The Federal Reserve Bank of Philadelphia has released the coincident indexes for the 50 states for March 2025. Over the
past three months, the indexes increased in 43 states, decreased in four states, and remained stable in three, for a three-month
diffusion index of 78. Additionally, in the past month, the indexes increased in 39 states, decreased in seven states, and
remained stable in four, for a one-month diffusion index of 64. For comparison purposes, the Philadelphia Fed has also
developed a similar coincident index for the entire United States. The Philadelphia Fed’s U.S. index increased 0.6 percent
over the past three months and 0.2 percent in March.
emphasis added
Note: These are coincident indexes constructed from state employment data. An explanation from the Philly Fed:
The coincident indexes combine four state-level indicators to summarize current economic conditions in a single statistic. The four state-level variables in each coincident index are nonfarm payroll employment, average hours worked in manufacturing by production workers, the unemployment rate, and wage and salary disbursements deflated by the consumer price index (U.S. city average). The trend for each state’s index is set to the trend of its gross domestic product (GDP), so long-term growth in the state’s index matches long-term growth in its GDP.

Click on map for larger image.
Here is a map of the three-month change in the Philly Fed state coincident indicators. This map was all red during the worst of the Pandemic and also at the worst of the Great Recession.
The map is mostly positive on a three-month basis.
Source: Philly Fed.
 And here is a graph is of the number of states with one month increasing activity according to the Philly Fed.
In March, 41 states had increasing activity including minor increases.


Leave a Reply