Other key reports include the February Trade Deficit and March Auto Sales.
For manufacturing, the March ISM Manufacturing and Dallas Fed surveys will be released.
—– Monday, March 31st —–
9:45 AM: Chicago Purchasing Managers Index for March. The consensus is for a reading of 45.5, unchanged from 45.5 in February.
10:30 AM: Dallas Fed Survey of Manufacturing Activity for March. This is the last of the regional surveys for March.
—– Tuesday, April 1st —–
 10:00 AM ET: Job Openings and Labor Turnover Survey for February from the BLS.
This graph shows job openings (black line), hires (dark blue), Layoff, Discharges and other (red column), and Quits (light blue column) from the JOLTS.
Jobs openings increased in January to 7.74 million from 7.51 million in December.
The number of job openings (black) were down 9% year-over-year. Quits were down 3% year-over-year.
10:00 AM: ISM Manufacturing Index for March. The consensus is for the ISM to be at 50.3, unchanged from 50.3 in February.
10:00 AM: Construction Spending for February. The consensus is for 0.2% increase in construction spending.

This graph shows light vehicle sales since the BEA started keeping data in 1967. The dashed line is the February sales rate.
—– Wednesday, April 2nd —–
7:00 AM ET: The Mortgage Bankers Association (MBA) will release the results for the mortgage purchase applications index.
8:15 AM: The ADP Employment Report for March. This report is for private payrolls only (no government). The consensus is for 119,000 payroll jobs added in March, up from 77,000 added in February.
—– Thursday, April 3rd —–
8:30 AM: The initial weekly unemployment claims report will be released. The consensus is for 225 initial claims up from 224 thousand last week.

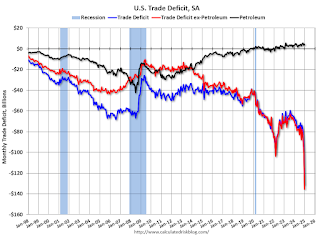
This graph shows the U.S. trade deficit, with and without petroleum, through the most recent report. The blue line is the total deficit, and the black line is the petroleum deficit, and the red line is the trade deficit ex-petroleum products.
The consensus is the trade deficit to be $110.0 billion. The U.S. trade deficit was at $131.4 billion in January.
10:00 AM: the ISM Services Index for March.
—– Friday, April 4th —–
 8:30 AM: Employment Report for March. The consensus is for 135,000 jobs added, and for the unemployment rate to be unchanged at 4.1%.
There were 151,000 jobs added in February, and the unemployment rate was at 4.1%.
This graph shows the jobs added per month since January 2021.
11:25 AM: Speech, Fed Chair Jerome Powell, Economic Outlook, At the Society for Advancing Business Editing and Writing (SABEW) Annual Conference, Arlington, Virginia


Leave a Reply