by Calculated Risk on 4/08/2025 02:17:00 PM
Note: I’ve received a number of requests to post this again after the start of President Trump’s 2nd term. So here is another update of tracking employment during Presidential terms. We frequently use Presidential terms as time markers – we could use Speaker of the House, Fed Chair, or any other marker.
Important: There are many differences between these periods. Overall employment was smaller in the ’80s, however the participation rate was increasing in the ’80s (younger population and women joining the labor force), and the participation rate is generally declining now. But these graphs give an overview of employment changes.
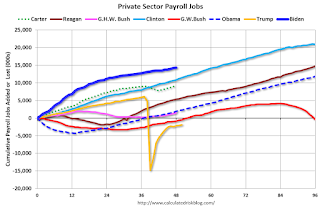
The first graph shows the change in private sector payroll jobs from when each president took office until the end of their term(s). Presidents Carter, George H.W. Bush, and Biden only served one term.
Mr. G.W. Bush (red) took office following the bursting of the stock market bubble and left during the bursting of the housing bubble. Mr. Obama (dark blue) took office during the financial crisis and great recession. There was also a significant recession in the early ’80s right after Mr. Reagan (dark red) took office.
There was a recession towards the end of President G.H.W. Bush (light purple) term, and Mr. Clinton (light blue) served for eight years without a recession. There was a pandemic related recession in 2020.
First, here is a table for private sector jobs for each term. (Blue for Democrats, Red for Republicans)
| Term | Private Sector Jobs Added (000s) |
|---|---|
| Biden | 14,327 |
| Clinton 1 | 10,875 |
| Clinton 2 | 10,104 |
| Obama 2 | 9,924 |
| Reagan 2 | 9,351 |
| Carter | 9,039 |
| Reagan 1 | 5,363 |
| Obama 1 | 1,889 |
| GHW Bush | 1,507 |
| GW Bush 2 | 453 |
| Trump 2 | 3251 |
| GW Bush 1 | -822 |
| Trump 1 | -2,178 |
| 1Through 2 months | |
 Click on graph for larger image.
The first graph is for private employment only.
Private sector employment increased by 9,039,000 under President Carter (dashed green), by 14,714,000 under President Reagan (dark red), 1,507,000 under President G.H.W. Bush (light purple), 20,979,000 under President Clinton (light blue), lost 369,000 under President G.W. Bush, and gained 11,813,000 under President Obama (dark dashed blue). During President Trump’s terms (Orange), the economy has lost 1,853,000 private sector jobs.
 A big difference between the presidencies has been public sector employment. Note: the bumps in public sector employment due to the decennial Census in 1980, 1990, 2000, 2010 and 2020.
The public sector grew during Mr. Carter’s term (up 1,304,000), during Mr. Reagan’s terms (up 1,414,000), during Mr. G.H.W. Bush’s term (up 1,127,000), during Mr. Clinton’s terms (up 1,934,000), and during Mr. G.W. Bush’s terms (up 1,744,000 jobs). However, the public sector declined significantly while Mr. Obama was in office (down 263,000 jobs). During Mr. Trump’s terms, the economy lost 517,000 public sector jobs (mostly teachers during the pandemic).
And a table for public sector jobs. Public sector jobs increased have increased the most during Biden’s term (mostly state and local employment), ahead of the number during Reagan’s 2nd term. Public sector jobs declined the most during Obama’s first term.
| Term | Public Sector Jobs Added (000s) |
|---|---|
| Biden | 1,813 |
| Reagan 2 | 1,438 |
| Carter | 1,304 |
| Clinton 2 | 1,242 |
| GHW Bush | 1,127 |
| GW Bush 1 | 900 |
| GW Bush 2 | 844 |
| Clinton 1 | 692 |
| Obama 2 | 447 |
| Trump 2 | 201 |
| Reagan 1 | -24 |
| Trump | -537 |
| Obama 1 | -710 |
| 1Through 2 months | |


Leave a Reply