by Calculated Risk on 3/13/2025 03:55:00 PM
This will be something to watch. The Top 3 countries for tourist visits to the US in 2023 were:
1) Canada 31% in 2023
2) Mexico 22% in 2023
3) UK 6% in 2023
And it appears there has been a sharp decline in Canadians traveling to the U.S. United Airlines CEO noted that their weaker outlook is due to a drop in traffic:
“We’ve already started the process of where that capacity is coming out. A lot of it transborder, big drop in Canadian traffic to go into the U.S.”.
This could impact hotel occupancy in the U.S.
The U.S. hotel industry reported mixed year-over-year comparisons, according to CoStar’s latest data through 8 March. …
2-8 March 2025 (percentage change from comparable week in 2024):
• Occupancy: 62.4% (-1.4%)
• Average daily rate (ADR): US$160.53 (+2.1%)
• Revenue per available room (RevPAR): US$100.11 (+0.6%)
emphasis added
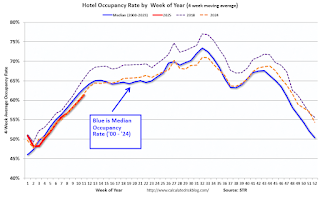
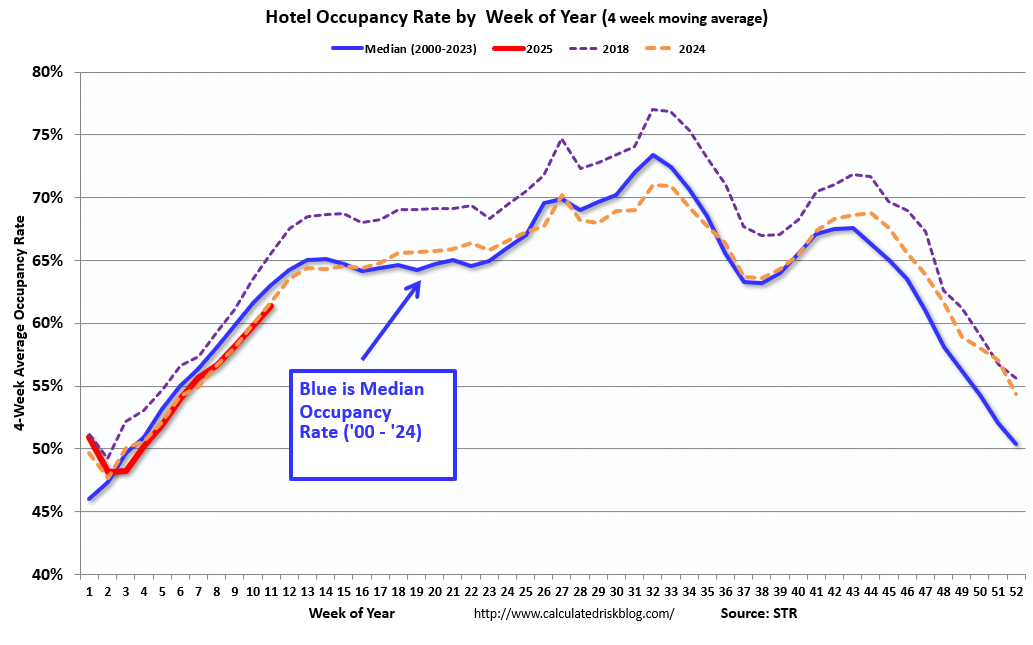
The following graph shows the seasonal pattern for the hotel occupancy rate using the four-week average.
 Click on graph for larger image.
The red line is for 2025, blue is the median, and dashed light blue is for 2024. Dashed purple is for 2018, the record year for hotel occupancy.
The 4-week average of the occupancy rate is tracking last year and is lower than the median rate for the period 2000 through 2024 (Blue).
Note: Y-axis doesn’t start at zero to better show the seasonal change.
The 4-week average will increase seasonally for the next several weeks.


Leave a Reply