
by Calculated Risk on 2/25/2025 09:00:00 AM
S&P/Case-Shiller released the monthly Home Price Indices for December (“December” is a 3-month average of October, November and December closing prices).
This release includes prices for 20 individual cities, two composite indices (for 10 cities and 20 cities) and the monthly National index.
From S&P S&P CoreLogic Case-Shiller Index Records 3.9% Annual Gain in December 2024
The S&P CoreLogic Case-Shiller U.S. National Home Price NSA Index, covering all nine U.S. census
divisions, reported a 3.9% annual return for December, up from a 3.7% annual gain in the previous
month. The 10-City Composite saw an annual increase of 5.1%, up from a 5% annual increase in the
previous month. The 20-City Composite posted a year-over-year increase of 4.5%, up from a 4.3%
increase in the previous month. New York again reported the highest annual gain among the 20 cities
with a 7.2% increase in December, followed by Chicago and Boston with annual increases of 6.6% and
6.3%, respectively. Tampa posted the lowest return, falling 1.1%.
…
The pre-seasonally adjusted U.S. National and 20-City Composite Indices’ upward trends continued to
reverse in December, with both posting a -0.1% drop. The 10-City Composite’s monthly return dropped
0.04%.After seasonal adjustment, the U.S. National, 20-City, and 10-City Composite Indices all posted a
month-over-month increase of 0.5%.“It has been five years since the Covid-19 outbreak took hold of the global economy, sparking
unprecedented volatility, massive fiscal and monetary stimulus, and a housing market that responded
to national migratory changes in how we work and where we live,” says Brian D. Luke, CFA, Head of
Commodities, Real & Digital Assets at S&P Dow Jones Indices. “National home prices have risen by
8.8% annually since 2020, led by markets in Florida, North Carolina, Southern California, and Arizona.
While our National Index continues to trend above inflation, we are a few years removed from peak
home price appreciation of 18.9% observed in 2021 and are seeing below-trend growth over the history
of the index.“Home prices stalled during the second half of the year with markets in the West dropping the fastest.
San Francisco, the worst performing market since 2020, dropped 4.5% during the last six months of the
year, followed by Seattle with a 3.0% decline. San Francisco is now 11.0% lower than its post-pandemic peak reached in May 2022. Previous strongholds like San Diego and Tampa experienced
declines of 2.9% and 2.7%, respectively, during the second half of the year. After accounting for
seasonal adjustments, our National Index pushed forward to achieve a 19th consecutive all-time high,”
Luke continued. “The longest such streak occurred for over 12-years, notching 153 consecutive all-time
highs from July 1993 to March 2006.“The Northeast continues to lead all regions with above-trend growth, led by New York for the eighth
consecutive time. Boston reached an all-time high, the only market to do so for the period ended
December 2024.”
emphasis added
 Click on graph for larger image.
The first graph shows the nominal seasonally adjusted Composite 10, Composite 20 and National indices (the Composite 20 was started in January 2000).
The Composite 10 index was up 0.5% in December (SA). The Composite 20 index was up 0.5% (SA) in December.
The National index was up 0.5% (SA) in December.
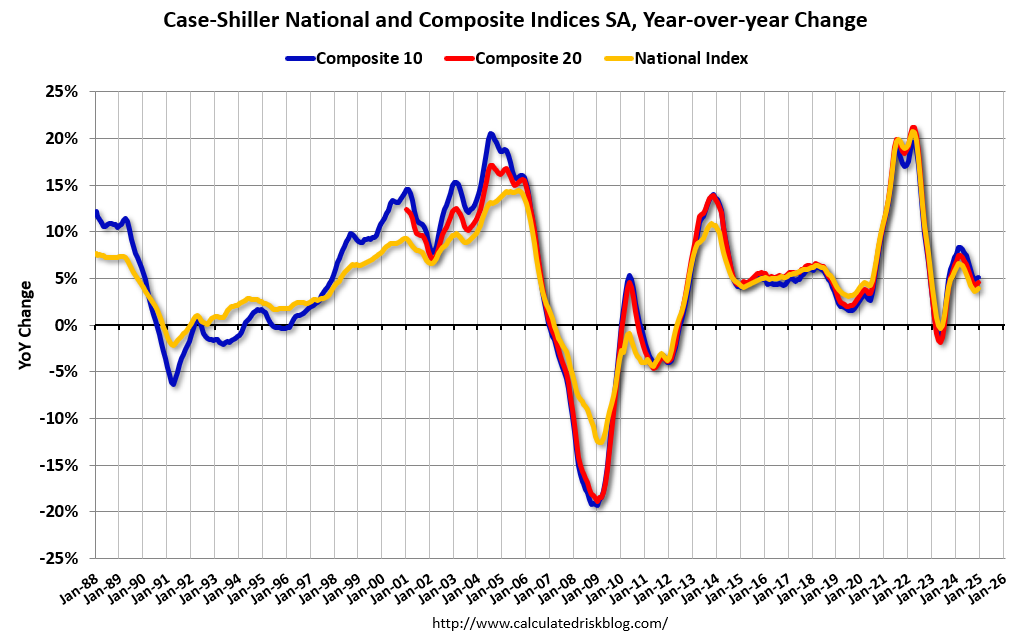 The second graph shows the year-over-year change in all three indices.
The Composite 10 NSA was up 5.1% year-over-year. The Composite 20 NSA was up 4.5% year-over-year.
The National index NSA was up 3.9% year-over-year.
Annual price changes were close to expectations. I’ll have more later.


Leave a Reply