
The Australian Bureau of Statistics (ABS) released the latest – Consumer Price Index, Australia – for the March-quarter 2025 today (April 30, 2025). The data showed that the inflation rate rose by 0.9 points in the quarter but over the 12 months was stable at 2.4 per cent . The inflation rate has been within the RBA’s inflation targeting range for the last 9 months and inflationary expectations are all within the range. There are no significant wage pressures evident. Using the RBA’s own logic, its policy interest rate should now be cut.
The summary, seasonally-adjusted Consumer Price Index results for the March-quarter 2025 are as follows:
| Component | Quarter % | Annual % |
| All groups CPI | 0.9 (last 0.2) | 2.4 (last 2.4) |
| Trimmed mean series | 0.5 (0.5) | 2.9 (3.2) |
| Weighted median series | 0.7 (0.5) | 3.0 (3.4) |
The following Table shows the rates of inflation for the major components of the CPI:
| Component | December-quarter % | Last 12 months % |
| All groups CPI | 0.9 | 2.4 |
| Food and non-alcoholic beverages | 1.2 | 3.2 |
| Alcohol and tobacco | 1.2 | 6.5 |
| Clothing and footwear | -0.8 | 1.7 |
| Housing | 1.7 | 2.0 |
| Furnishings, household equipment and services | -0.9 | 0.7 |
| Health | 2.9 | 4.1 |
| Transport | 1.0 | -1.05 |
| Communication | 0.3 | 0.0 |
| Recreation and culture | -1.6 | 1.7 |
| Education | 5.2 | 5.7 |
| Insurance and financial services | 0.5 | 3.8 |
The ABS Media Release – CPI rises 0.9% in the March 2025 quarter – noted that:
The Consumer Price Index (CPI) rose 0.9 per cent in the March 2025 quarter and 2.4 per cent annually …
… the March quarter increase of 0.9 per cent follows two quarters in a row of 0.2 per cent rises …
Trimmed mean annual inflation was 2.9 per cent in the March quarter, down from 3.3 per cent in the December quarter. This is the lowest annual trimmed mean inflation rate since the December 2021 quarter …
The main contributors to the quarterly CPI rise of 0.9 per cent were Housing (+1.7 per cent), Education (+5.2 per cent) and Food and non-alcoholic beverages (+1.2 per cent).
The quarterly growth in Housing was driven by Electricity (+16.3 per cent) …
… the impact from the Commonwealth Energy Bill Relief Fund (EBRF) rebates was lower in the March quarter compared to the December quarter due to the timing of rebate payments.
Education prices increased 5.2 per cent this quarter, following the start of the school year …
Observations:
1. The annual inflation rate remains steady.
2. The main drivers reflect price gouging by private education suppliers and private health care suppliers – which demonstrates the folly of supporting private education and privatised health care.
3. The fiscal support provided by the federal government to offset the price gouging by electricity companies, which has been a very effective anti-inflationary policy, is now being withdrawn and so electricity prices are rising faster than the general price level. The policy put paid to the notion that defeating a supply-side inflationary spiral requires fiscal austerity.
4. Further evidence of the positive fiscal effect is the effect of the changes in Commonwealth Rental Assistance, which has reduced the escalation in rental inflation.
5. The rent inflation is moderating as interest rates have started to fall. The inflation was largely driven by the RBA’s own rate hikes as landlords in a tight housing market have been passing on the higher borrowing costs – so the so-called inflation-fighting rate hikes were a significant force in driving inflation.
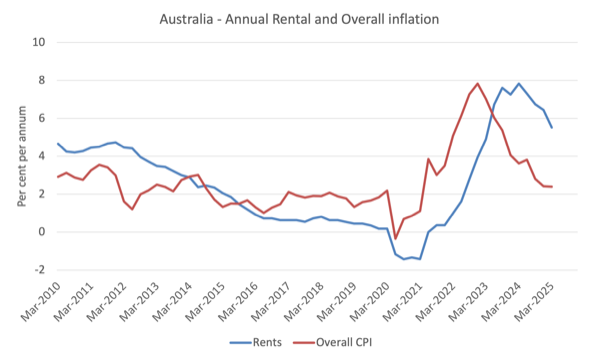
This graph shows that the overall inflation rate peaked in the December-quarter 2022 and has been steadily declining ever since.
However, rental inflation lagged the rise in overall inflation in 2021 and really only took off after the RBA started hiking interest rates.
Once the RBA ended its current hiking cycle, the rental inflation has stabilised and is now falling.
Trends in inflation – Steady
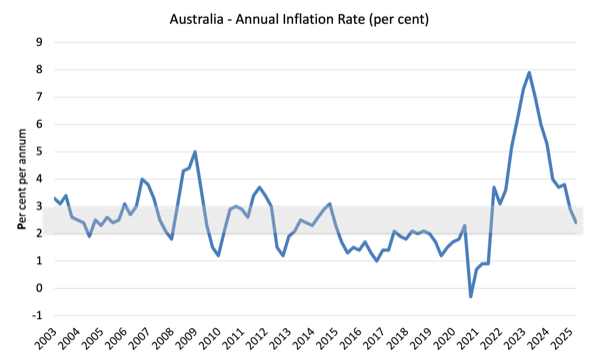
Over the last 12 months, the inflation rate was 2.4 per cent (steady).
The peak was in the December-quarter 2022 when the inflation rate was 7.8 per cent.
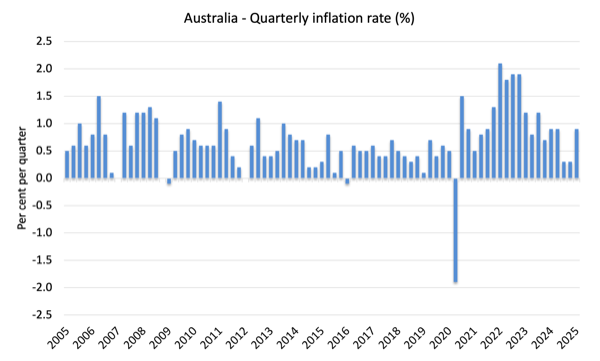
The following graph shows the quarterly inflation rate since the December-quarter 2005.
The next graph shows the annual headline inflation rate since the first-quarter 2002. The shaded area is the RBA’s so-called targetting range (but read below for an interpretation).
What is driving inflation in Australia?
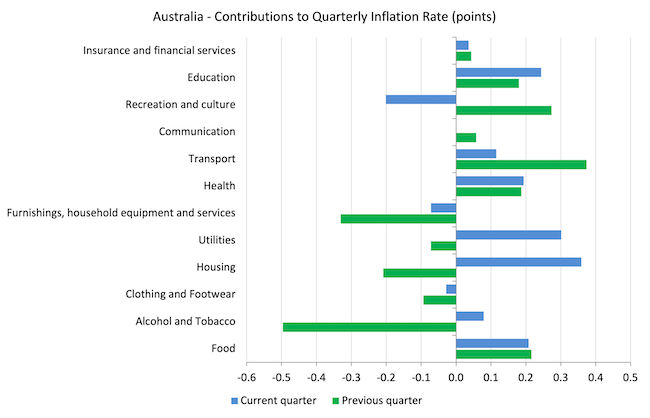
The following bar chart compares the contributions to the quarterly change in the CPI for the March-quarter 2025 (blue bars) compared to the December-quarter 2024 (green bars).
Note that Utilities is a sub-group of Housing and are significantly impacted by government administrative decisions, which allow the privatised companies to push up prices each year, usually well in excess of CPI movements.
The impact of fiscal policy on that sub-group via the electricity rebates has obviously been significant, which goes to show that governments can moderate inflation through expansionary fiscal policy if the drivers are from the supply-side.
It also demonstrates that monetary policy is ineffective in dealing with this type of inflation.
As noted above, one of the major contributors, Education, is being driven by profit-gouging in the private education sector.
The next graph shows the contributions in points to the annual inflation rate by the various components.
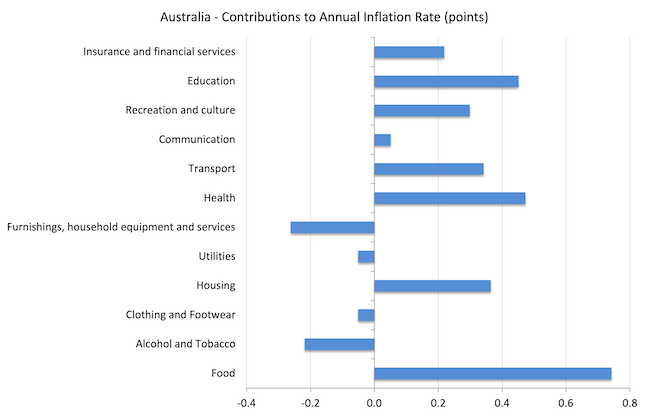
The ABS noted that:
Electricity prices rose 16.3 per cent this quarter. This follows falls of 17.3 per cent in the September quarter and 9.9 per cent in the December quarter due to the introduction of the second round of the Commonwealth Energy Bill Relief Fund (EBRF) rebates from July 2024, which was expanded to include all households.
The rise this quarter was expected as most households in Brisbane have used up the $1,000 Queensland State government electricity rebate resulting in higher out of pocket electricity costs. Some households in the remaining states and territories also saw increases in the amounts payable on their electricity bills this quarter compared to last quarter. This was due to the impact from the Commonwealth EBRF rebates being lower in the March quarter compared to the December quarter due to the timing of rebate payments …
Excluding the rebates, Electricity prices would have risen 0.4% this quarter as retailers in some capital cities increased supply and usage charges or decreased discounts for market offer plans.
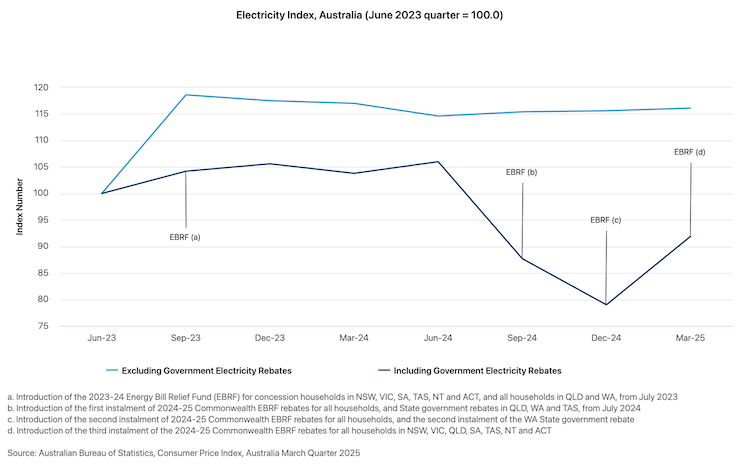
The next graph is taken from the ABS and shows the impact of fiscal policy in reducing the inflation rate.
EBRF refers to the government’s Energy Bill Relief Fund.
Inflation and Expected Inflation
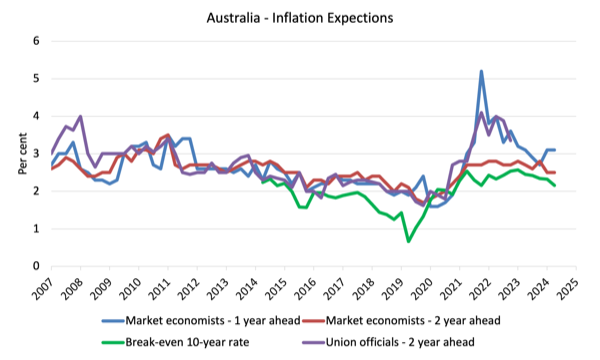
The following graph shows four measures of expected inflation produced by the RBA from the December-quarter 2005 to the December-quarter 2023.
The four measures are:
1. Market economists’ inflation expectations – 1-year ahead.
2. Market economists’ inflation expectations – 2-year ahead – so what they think inflation will be in 2 years time.
3. Break-even 10-year inflation rate – The average annual inflation rate implied by the difference between 10-year nominal bond yield and 10-year inflation indexed bond yield. This is a measure of the market sentiment to inflation risk. This is considered the most reliable indicator.
4. Union officials’ inflation expectations – 2-year ahead – this series hasn’t been updated since the September-quarter 2023.
Notwithstanding the systematic errors in the forecasts, the price expectations (as measured by these series) are now falling or are steady.
The Break-even 10-year inflation rate and the Market economists’ inflation expectations 2-year ahead the expectations remain well within the RBA’s inflation targeting range (2-3 per cent) and are declining.
So the RBA cannot claim that fears of accelerating expecations are preventing them from cutting interest rates further.
Implications for monetary policy
What does this all mean for monetary policy?
The Consumer Price Index (CPI) is designed to reflect a broad basket of goods and services (the ‘regimen’) which are representative of the cost of living. You can learn more about the CPI regimen HERE.
The RBA’s formal inflation targeting rule aims to keep annual inflation rate (measured by the consumer price index) between 2 and 3 per cent over the medium term.
However, the RBA uses a range of measures to ascertain whether they believe there are persistent inflation threats.
Please read my blog post – Australian inflation trending down – lower oil prices and subdued economy (January 29, 2015) – for a detailed discussion about the use of the headline rate of inflation and other analytical inflation measures.
The RBA claims it does not rely on the ‘headline’ inflation rate.
Instead, they use two measures of underlying inflation which attempt to net out the most volatile price movements.
The concept of underlying inflation is an attempt to separate the trend (the persistent component of inflation) from the short-term fluctuations in prices.
The main source of short-term ‘noise’ comes from “fluctuations in commodity markets and agricultural conditions, policy changes, or seasonal or infrequent price resetting”.
The RBA uses several different measures of underlying inflation which are generally categorised as ‘exclusion-based measures’ and ‘trimmed-mean measures’.
So, you can exclude “a particular set of volatile items – namely fruit, vegetables and automotive fuel” to get a better picture of the “persistent inflation pressures in the economy”.
The main weaknesses with this method is that there can be “large temporary movements in components of the CPI that are not excluded” and volatile components can still be trending up (as in energy prices) or down.
The alternative trimmed-mean measures are popular among central bankers.
The authors say:
The trimmed-mean rate of inflation is defined as the average rate of inflation after “trimming” away a certain percentage of the distribution of price changes at both ends of that distribution. These measures are calculated by ordering the seasonally adjusted price changes for all CPI components in any period from lowest to highest, trimming away those that lie at the two outer edges of the distribution of price changes for that period, and then calculating an average inflation rate from the remaining set of price changes.
So you get some measure of central tendency not by exclusion but by giving lower weighting to volatile elements. Two trimmed measures are used by the RBA: (a) “the 15 per cent trimmed mean (which trims away the 15 per cent of items with both the smallest and largest price changes)”; and (b) “the weighted median (which is the price change at the 50th percentile by weight of the distribution of price changes)”.
So what has been happening with these different measures?
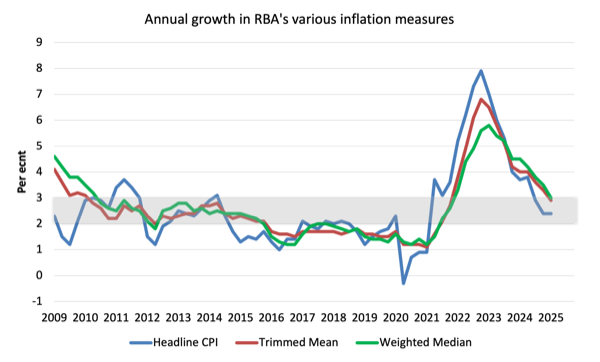
The following graph shows the three main inflation series published by the ABS since the December-quarter 2009 – the annual percentage change in the All items CPI (blue line); the annual changes in the weighted median (green line) and the trimmed mean (red line).
The latest data for the three measures shows:
| Component | Quarter % | Annual % |
| All groups CPI | 0.9 (last 0.2) | 2.4 (last 2.4) |
| Trimmed mean series | 0.7 (0.5) | 2.9 (3.2) |
| Weighted median series | 0.7 (0.5) | 3.0 (3.4) |
The following graph shows the evolution of these series since 2009.
How to we assess these results?
1. The RBA’s preferred measures are now within their targeting range.
2. There is no wages pressure coming from the labour market.
3. Inflationary expectations are benign or falling.
4. All the indicators support a further cut in the policy interest rate.
Conclusion
The latest CPI data showed that the annual inflation rate is stable and is firmly within the RBA’s inflation targeting range with no signs of an acceleration pending.
All the indicators support a further cut in the policy interest rate.
That is enough for today!
(c) Copyright 2025 William Mitchell. All Rights Reserved.


![Intel reiterated it was planning to ramp up the 18A process to high-volume production this year [File]](https://todaysnewsbro.com/wp-content/uploads/2025/04/1745992712_1x1_spacer.png)


Leave a Reply